Hi,
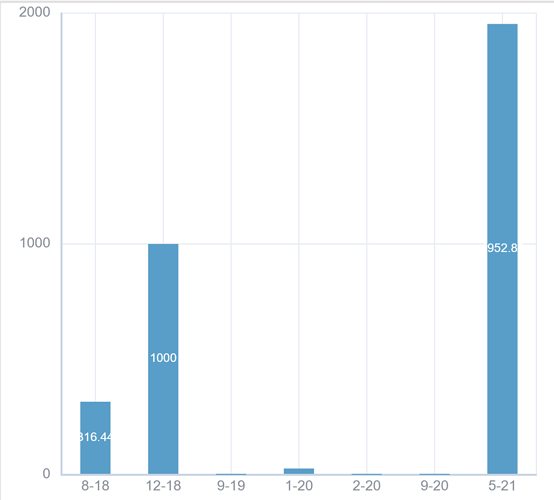
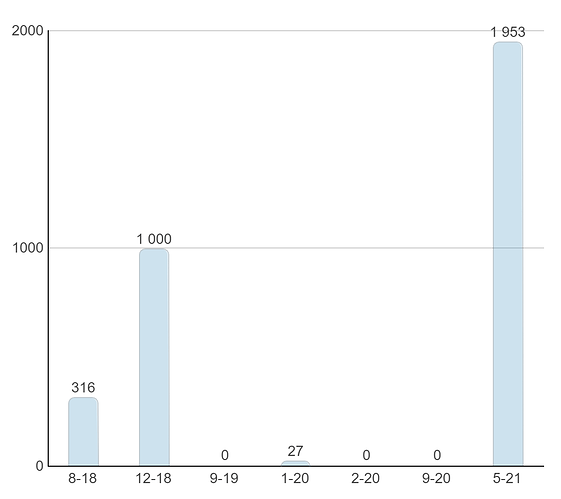
Due to a canvas bug with iOS, we need to migrate our Charts to the latest version.
There are some differences on the look & feel:
- Is it possible to display value on top of bar ?
- How can we change the color of text ?
- we use to have a radius property; does it exist in the new Version ?
Thanks for your help,
I apologize for the delay with the reply.
- Is it possible to display value on top of bar ?
Unfortunately, such a feature is no supported.
- How can we change the color of text ?
You may try to apply the css. Something like:
<style>
    .dhx_chart .bar-text{
        fill:#000000;
    }
</style>
https://snippet.dhtmlx.com/z7yyq6nz
- we use to have a radius property; does it exist in the new Version ?
Unfortunately due to the svg structure of the chart bars currently it is not available to customize its look.
Hi,
Thank you for your response.
It is really unfortunate to lose functionality with a more advanced version.
We have to give up using Dhtmlx and find another solution.
Regards,

