Multiple grouping in chart

Hi,

I have a dhtmlxGrid with the following structure.

S.no | Part Code | Description | Date | Quantity | Direction | Details | balance
1 | 12345.131 | ABCD |2014-01-01| 1 | Inbound | desc1 | 5
2 | 12345.123 | XYZ |2014-02-01| 2 | Outbound | desc2 | 3
.
.
.

now, i wish to create a stacked bar graph for the above grid that shows the total number of inbound and outbound parts grouped by date.

thus, the graph must show all inbound parts on 2014-01-01 in one color and outbound parts in another.

I am able to group the parts by date and sum them up but i am not able to differentiate in outound and inbound.
Please help. This is urgent.

Hi
In theory stackedBar chart will suit you, but…
dhtmlx.com/docs/products/dht … chart.html
Unfortunatelly dhtmlxChart doesn’t allow such data grouping.

We can suggest you 2 ways:
1) reform your data structure
I.e. you have the next structure

var data = [ {id: 1, balance: 3, data: "2014-02-01", direction: "inbox"}, {id: 2, balance: 5, data: "2014-02-01", direction: "outbox"}, {id: 3, balance: 4, data: "2014-02-02", direction: "inbox"}, {id: 4, balance: 7, data: "2014-02-02", direction: "outbox"} ];
You can restruct it to

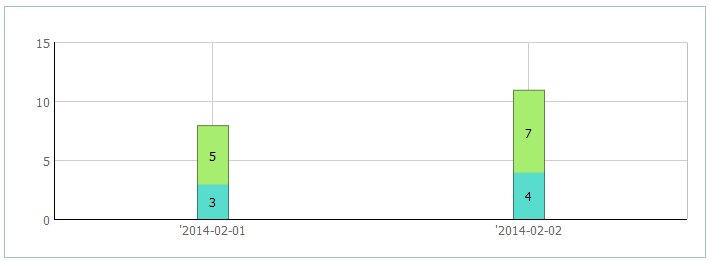
var data = [ {id: 1, balanceInbox: 3, balanceOutbox: 5, data: "2014-02-01"}, {id: 3, balanceInbox: 4, balanceOutbox: 7, data: "2014-02-02"} ];
And then you can buid your chart using “stackedBar” view the next way:

[code]var barChart1 = new dhtmlXChart({
view:“stackedBar”,
container:“chart1”,
value:“#balanceInbox#”,
label:“#balanceInbox#”,
color: “#58dccd”,
xAxis:{
template:“'#data#”
},
yAxis:{}
});

	barChart1.addSeries({
	    value:"#balanceOutbox#",
		color:"#a7ee70",
		label:"#balanceOutbox#"
	});
	barChart1.parse(data,"json");[/code]

The result is:


2) build 2 charts: one will be with “Inbound” direction filtering, the second - with “Outbound” filtering
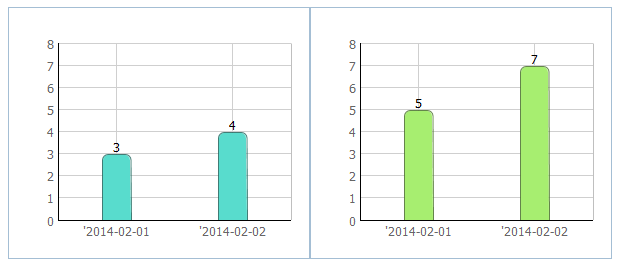
Based on the code sample below it will be:

[code]var barChart1 = new dhtmlXChart({
view:“bar”,
container:“chart1”,
value:“#balance#”,
label:“#balance#”,
color: “#58dccd”,
xAxis:{
template:“'#data#”
},
yAxis:{
start: 0,
end: 8,
step: 1
}
});
barChart1.parse(data,“json”);
barChart1.filter(function(obj){
return obj.direction == “inbox”;
});
barChart1.render();

	var barChart2 =  new dhtmlXChart({
		view:"bar",
		container:"chart2",
		value:"#balance#",
		label:"#balance#",
		color: "#a7ee70",
		xAxis:{
			template:"'#data#"
		},
		yAxis:{
			start: 0,
			end: 8,
			step: 1}
	});
	barChart2.parse(data,"json");
	barChart2.filter(function(obj){
		return obj.direction == "outbox";
	});
	barChart2.render();[/code]

The result is:
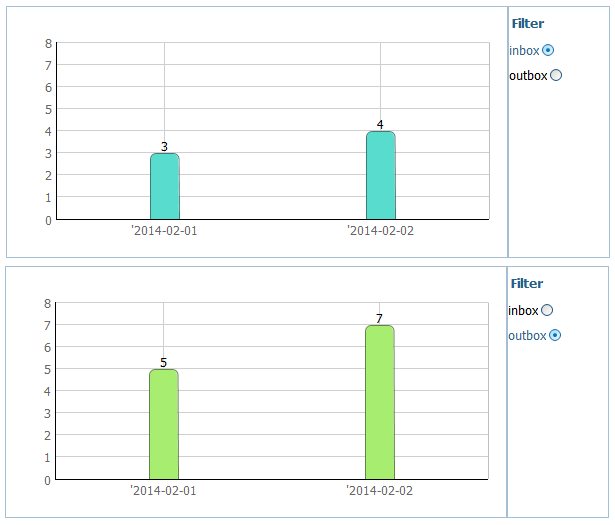
Or in point 2 you can use view changer, i.e. via dhxtmlForm. Code sabple is below:

[code]var data = [
{id: 1, balance: 3, data: “2014-02-01”, direction: “inbox”},
{id: 2, balance: 5, data: “2014-02-01”, direction: “outbox”},
{id: 3, balance: 4, data: “2014-02-02”, direction: “inbox”},
{id: 4, balance: 7, data: “2014-02-02”, direction: “outbox”}
];
var formData = [
{type: “label”, label: “Filter”},
{type: “radio”, name: “Filter”, value: “inbox”, label: “inbox”, checked: true},
{type: “radio”, name: “Filter”, value: “outbox”, label: “outbox”}
];
function doOnLoad(){
barChart1 = new dhtmlXChart({
view:“bar”,
container:“chart1”,
value:“#balance#”,
label:“#balance#”,
color: function(obj){
if (obj.direction == “inbox”) return “#58dccd”;
return “#a7ee70”;
},
xAxis:{
template:“'#data#”
},
yAxis:{
start: 0,
end: 8,
step: 1
}
});
myForm = new dhtmlXForm(“form2”, formData);
barChart1.parse(data,“json”);
filterChart(myForm.getCheckedValue(“Filter”));

			myForm.attachEvent("onChange", function(id,value){
				filterChart(value);
			});
		}
		function filterChart(value){
			barChart1.filter(function(obj){
				return obj.direction == value;
			});
			barChart1.render();
		}[/code]

The result is:


Hi Darya,
Thank you for your prompt reply.
The second option does help me out. Can we attach it to dhtmlxWindows?
and
In the first option, can we have the two charts in a single container?

The second option does help me out. Can we attach it to dhtmlxWindows?
Here is a sample of using chart attached to window
dhtmlx.com/docs/products/dht … ndows.html

In the first option, can we have the two charts in a single container?
What do you mean? To build in one common div?

Hi Darya,

What do you mean? To build in one common div?

yes. I want to have two charts side by side in a single div. So both the charts can be viewed at the same time.

Also if you could help me in ine more thing.

Using the code that i currently have, i did attach the chart to a window, but the chart is also visible on the page. if I try to make the chart div hidden using CSS ( i use the display:none property) the window loses the chart as well.

( i did make the display property to be block using javascript before initializing the window)

yes. I want to have two charts side by side in a single div. So both the charts can be viewed at the same time.
There is no possibility to do that: the next one chart will cover previous one and you will not get excepting graphic result.

Also if you could help me in ine more thing.
Locally it works fine like in online sample. We need your demo to test the code you have.
You can make only chart + window simple demo with a standard dhx edition.

I changed my code according to the example you gave me.

my code now looks like this

	var dhxWins = new dhtmlXWindows(dhxWinsParams);
				myChart = dhxWins.window("chart_win").attachChart({
					view:"BarH",
					value:"#data4#",
					label:"#data4#",
					color:"#58dccd",
					barWidth:60,
					alpha:0.8,
					yAxis:{template:"#id#"},
					xAxis:{
						start:0,
						step:10,
						end:50
					},
					group:{
						by:"#data3#",
						map:{
								data4:["#data4#","sum"]
						}
					},
					legend:{
						values:[{
							text:"Inbound",
							color:"#58dccd"
						}],
						valign:"top",
						align:"center",
						width:90,
						layout:"x"
					}
				});
				
				myChart.parse(grid,"dhtmlxgrid");
				

But it keeps giving me the following error

Error: Object doesn’t support property or method

Is there some property I am adding that should not be there?
When I remove this code, the error goes away.
With this code, i do get the window with the legend but no chart. :frowning:

Could you provide little part of your xml please to test your code snippet?

Hi,

My xml looks like this


var xmString= "<rows><row id=\"1\">
<cell>1</cell>
<cell>1234</cell>
<cell>abcd</cell>
<cell>2014-01-24</cell>
<cell>2</cell>
<cell>Inbound Stock</cell>
<cell>test removal</cell>
<cell>null</cell>
</row>
<row id=\"2\">
<cell>2</cell>
<cell>6507</cell>
<cell>xyz</cell>
<cell>2014-01-22</cell>
<cell>3</cell>
<cell>Inbound Stock</cell>
<cell>fgujghj</cell>
<cell>null</cell>
</row>
<row id=\"3\">
<cell>3</cell>
<cell>6507</cell>
<cell>xyz</cell>
<cell>2014-01-24</cell>
<cell>3</cell>
<cell>Inbound Stock</cell>
<cell>test inbound spares</cell>
<cell>null</cell>
</row>
<row id=\"4\">
<cell>4</cell>
<cell>6507</cell>
<cell>xyz</cell>
<cell>2014-01-23</cell>
<cell>2</cell>
<cell>Outbound Stock</cell>
<cell>test outbound spares</cell>
<cell>null</cell>
</row>
<row id=\"5\">
<cell>5</cell>
<cell>1234</cell>
<cell>abcd</cell>
<cell>2014-01-24</cell>
<cell>1</cell>
<cell>Inbound Stock</cell>
<cell>test inboud 2</cell>
<cell>null</cell>
</row>
<row id=\"6\">
<cell>6</cell>
<cell>123</cell>
<cell>defg</cell>
<cell>2014-01-01</cell>
<cell>1</cell>
<cell>Outbound Stock</cell>
<cell>qwerty</cell>
<cell>null</cell>
</row>
</rows";

and my grid structure is like this

[code]grid = new dhtmlXGridObject(“report_grid”);
grid.setImagePath(“dhtmlx/dhtmlxGrid/codebase/imgs/”);
grid.setSkin(“dhx_skyblue”);
grid.setHeader(“Report,#cspan,#cspan,#cspan,#cspan,#cspan,#cspan,#cspan”);
grid.attachHeader(“S.No.,Part Code,Description,Date,Quantity,Short Description,Detailed Description,Balance Stock”);
grid.setColTypes(“cntr,ro,ro,ro,ro,ro,ro,ro”);
grid.setColAlign(“center,center,center,center,center,center,center,center”);
grid.setInitWidths(“50,,,,,,,*”);
grid.enableSmartRendering(true,50);
grid.enableAutoWidth(true);
grid.enableMultiline(true);
grid.init();

grid.parse(xmlString,“xml”);[/code]

Could you clarify your question, please?

Hi,
when i use the above code to create a chart using dhtmlxrgrid attached to a dhtmlxwindow,
the chart is not displayed. Instead, the browser shows an error that says object does not support property or method. The window created contains only the legend and no chart.

If i draw this chart without a window, the chart is drawn correctly.
Is there some function that i am using in my code that should not be present.
If you need a demo please let me know.

I decided to forego the grid completely and got the data from a separate json file.
It is displaying correctly now, but if you could take out some time and explain why it is not working with the grid, i’ll be most grateful.

Thank you for all your help. :slight_smile:

So, let’s try to inspect your demo :slight_smile:
But attach it here without PRO grid files please

Hi,
I use the standard version only. :slight_smile:

Please find attached the demo.
complete demo_chart.zip (185 KB)

  1. replace “BarH” with “barH”
  2. place
    myChart.parse(grid,“dhtmlxgrid”);
    dhxWins.window(“w1”).hide();
    after in grid xml callback

Corrected code for demo is below:

[code]

Maintenance Plans
<link rel="STYLESHEET" type="text/css" href="codebase/dhtmlxgrid.css">
<link rel="STYLESHEET" type="text/css" href="codebase/skins/dhtmlxgrid_dhx_skyblue.css">
<link rel="STYLESHEET" type="text/css" href="codebase/dhtmlxchart.css"/>
<link rel="STYLESHEET" type="text/css" href="codebase/dhtmlxwindows.css"/>
<link rel="STYLESHEET" type="text/css" href="codebase/skins/dhtmlxwindows_dhx_skyblue.css"/>
	<script src="codebase/dhtmlxcommon.js"></script>
<script type = "text/javascript" src="codebase/dhtmlxgrid.js"></script>
	<script type = "text/javascript" src="codebase/dhtmlxgridcell.js"></script>
	<script type = "text/javascript" src="codebase/ext/dhtmlxgrid_filter.js"></script>
<script type = "text/javascript" src="codebase/dhtmlxchart.js"></script>
<script type = "text/javascript" src="codebase/dhtmlxcontainer.js"></script>
<script type = "text/javascript" src="codebase/dhtmlxwindows.js"></script>
[/code]

Thank you :slight_smile:

You are welcome!