Hello,
I am presently utilizing the latest Pro version.
I am currently confronted with a requirement.
I aspire to customize the time scale settings, specifically to display data in the day dimension for a particular year, in the month dimension for another year, and in the year dimension for yet another year.
I would like to inquire whether there exists an effective solution to achieve this customization.
I eagerly anticipate your response.
Meanwhile, I have an additional requirement concerning the render:“split”. In instances where overlap occurs within this mode, are there any methods to enhance the directness and clarity of its display? Could it be arranged in a staggered fashion with line breaks to improve visibility?
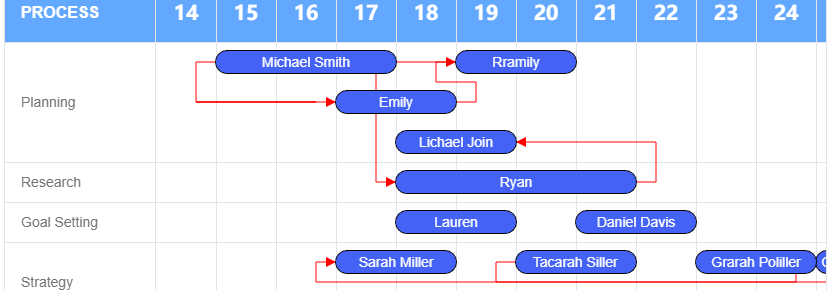
As shown in the example below
If the sub tasks Emily and Michael Smith overlap in time in Planning, they will be displayed on two lines. If Rramaily does not overlap, it will be displayed on the first line
I aspire to customize the time scale settings, specifically to display data in the day dimension for a particular year, in the month dimension for another year, and in the year dimension for yet another year.
You can achieve different levels of scales in DHTMLX Gantt using the zoom extension with specifying the required start_date and end_date configs. Firstly you need to configure your zoom config and then, you can set the required zoom level by using setLevel method and specify the required date range.
Please check the example of how it might be implemented: https://snippet.dhtmlx.com/ejb7gp60
Regarding that part:
In instances where overlap occurs within this mode, are there any methods to enhance the directness and clarity of its display?
You can create additional custom elements to the required “split” tasks with a help of addTaskLayer method. For example, show a custom line between subtasks.
Please check the example of how it might be implemented: https://snippet.dhtmlx.com/w6u0ioxp
Regarding that part:
Could it be arranged in a staggered fashion with line breaks to improve visibility?
Currently, when the split tasks overlap, Gantt doesn’t do anything with that. In the future, the dev team will add a feature to place overlapping tasks below one another. But I cannot give you any ETA. For now, you need to implement a custom solution by using the Gantt API and Javascript.It will require to handle an order calculation of subtasks and recalculation of timeline rows after each subtask update.
Here are examples that can help you to start implementing your solution: https://snippet.dhtmlx.com/1myeoxe9 https://snippet.dhtmlx.com/5vgu7jsr
Thank you very much for your timely response, it was very effective.
Regarding the first multidimensional question, I may not have made it clear. I want it to be displayed on the same instance page, not manually switched.
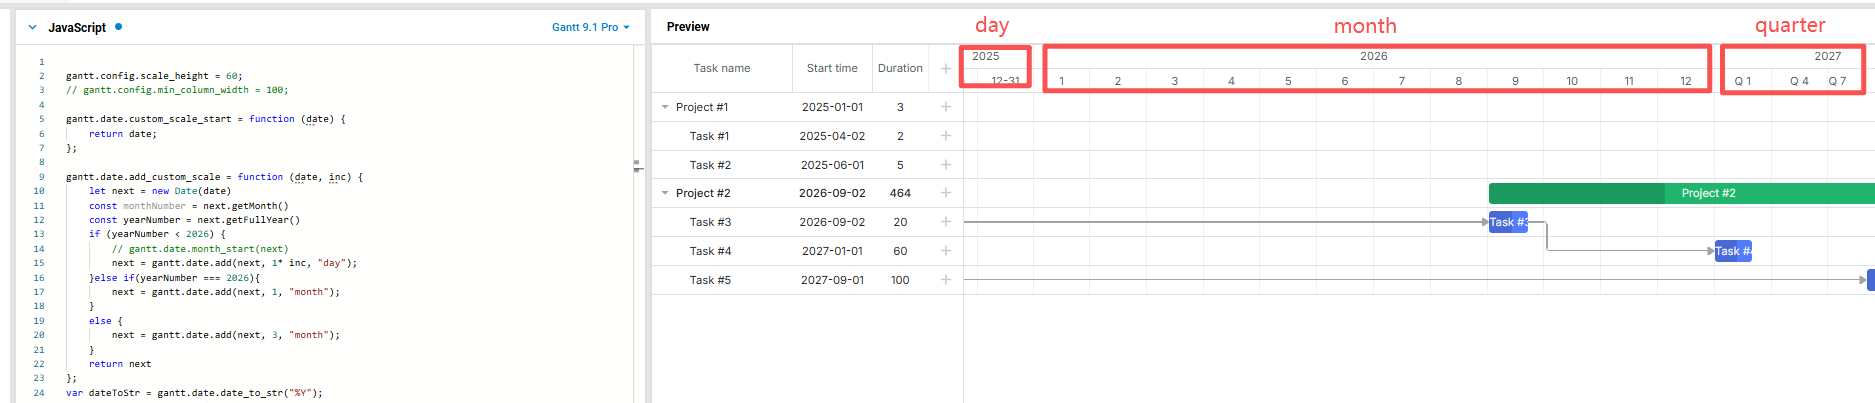
I implemented a simple demo using custom scales based on the example of figYearLabel, but found some issues, such as the week dimension not being able to be used in this method because it is not a complete month; There may be overlapping time between months and dimensions, months and years, which can lead to errors.
May I ask if there is a more suitable way to implement this requirement besides the method I am currently using? How should I handle the issue of time overlap conflicts in my usage method?
May I ask if there is a more suitable way to implement this requirement besides the method I am currently using? How should I handle the issue of time overlap conflicts in my usage method?
Unfortunately, the Gantt chart doesn’t support scales with different time intervals in a single view. It requires uniform intervals across all scales to accurately calculate task and project positions. While the API allows custom scales with varying intervals, this breaks the internal positioning logic, leading to incorrect rendering.
The most suitable option is to implement multiple zoom levels with predefined scales.
1 Like
Get a guaranteed answer from DHTMLX technical support team
under the most suitable support plan