Hi,
I am an amateur web programmer, work on the legacy systems. If the answer to any of the below questions are obvious, pardon my limited knowledge
I have a requirement to highlight or show/hide a series of chart when user hovers through legend label. I was hoping to get onMousemove even over legends and then use any method to show/hide a series from my graph.
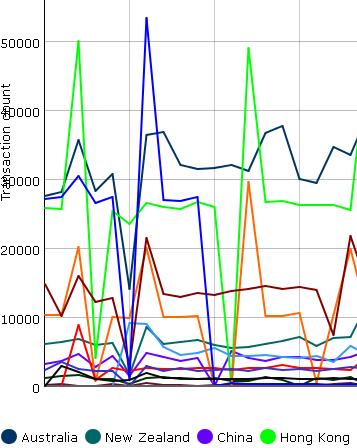
From the below graph you can see its quite cluttered, so I wanted to give a chance to users to highlight one item.2)
Is there any way to change the width property of a series?. In the same case above I wanted to increase the width of a series if user hovers over that series.
How do I quote 2 template properties for one graph? I have my vertical line as well as X-axis label defined conditional but only the last template is taking effect.
Code I have currently, Tooltip is a series in the JSON.
xAxis:{
lines:true,
template:function(obj){
if (chart.indexById(obj.id)%5){
chart.config.xAxis.lines = false;
return obj.xData;
}
chart.config.xAxis.lines = true;
return “”
},
template:function(obj){
var count = (chart.dataCount()/10).toFixed();
if (obj.id%count == 0 || obj.id == 1) return obj.Tooltip;
return “”;
},
Unfortunately, there is not possibility to catch legend events. Moreover, you will need to completely rebuild a chart to change its series. A series should be exluded from chart initialization if you want to hide it. And you can set another line width in new configuration of a certain series if you want to highlight it.
The following approach can be used if you want to call a function when a user hovers over a line:
chart.attachEvent("onMouseMove",function(id,e){
       var seriesIndex = (e.srcElement||e.target).getAttribute("userdata");
       /*your code*/
});
[code]var chart;
function createChart(){
if(chart)
chart.destructor();
chart = new dhtmlXChart({
…
}
[/code]
Thanks for your response, I will try to re-draw the graph and see how the performance part looks like.
The 3rd issue is, I have 100+ data point in the x-axis. for better visibility I am trying to show vertical graph lines for every 5th element of chart. Below function is a copy from from current forum to achieve this.
Along with this, I wanted to show x axis lables only for every 10th data point to avoid label getting overwritten with each other.
template:function(obj){
var count = (chart.dataCount()/10).toFixed();
if (obj.id%count == 0 || obj.id == 1) return obj.labelStr;
return “”;
},
When I enter these 2 seperate template method under new dhtmlXChart function only the last template is taking effect. In other words I am getting a graph with vertical line for every data point when labal part is working as expected.
Is there any way to combine these 2 template into one or quote 2 template method in one graph object
Get a guaranteed answer from DHTMLX technical support team
under the most suitable support plan