Hi
while trying to plot the date in x-axis
I tried implementing the below method:
xAxis:{
template:function(obj){
return dhtmlx.Date.date_to_str(“%d/%m/%Y”)(obj.$unit);
},
lineColor:function(obj){
return obj.$unit.valueOf() == (new Date(2016,1,1)).valueOf()?“#737373”:“#cfcfcf”
},
value:function(obj){
return dhtmlx.Date.str_to_date(“%d/%m/%Y”)(obj.date);
},
units:{
start:new Date(2016,7,1),
end:new Date(2016,7,20),
next:function(d){
return dhtmlx.Date.add(d, 1, “day”);
}
}
},
Uncaught TypeError: date.split is not a function is the error displayed. I am not able to understand the reason for this error
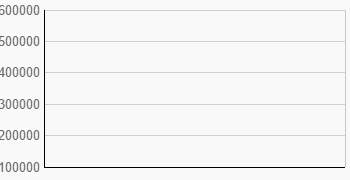
and when I gave the end date lesser than start date, I am able to view the graph but no values on x-axis and the values are not being plotted.
Kindly help me display the values in x-axis and display the line’s in x-axis.