oazizi
September 24, 2012, 11:06pm
#1
Hi,
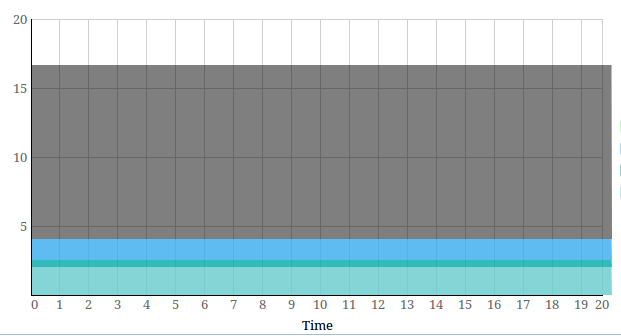
I’ve been using dhtmlx Charts and it’s been great. But one issue I’ve notice is that Area charts sometimes don’t fill up the x-axis properly. In other words, the data either overflows or underflows the end of the x-axis. I’ve attached an image as an example which shows data overflowing the x-axis.
Can anyone let me know what I might be doing wrong and how I can fix it?
Thank you!
Darya
September 25, 2012, 9:09am
#2
Hi
oazizi
October 5, 2012, 11:08pm
#3
Hi Darya,
Thanks for taking a look at this. Here’s a code snippet:
function createLineUsageChart(divname, datafile) {

    var chart = new dhtmlXChart({
        view: "stackedArea",
        container: divname,
        value: "#LINE_USAGE_A#",
        color: "#66cccc",
        gradient: "falling",
        alpha: 0.8,
        tooltip: {
            template: "#LINE_USAGE_A#"
        },
        xAxis: {
            title: "Time",
            template: "#SAMPLE#"
        },
        yAxis: {
            title: "Line Usage (millions)",
            template: function(obj) {
                return (obj / 1000000)
            }
        },
    })
    chart.addSeries({
        value: "#LINE_USAGE_B#",
        color:  "#00aaaa",
        tooltip: {
            template: "#LINE_USAGE_B#"
        },
     });
     chart.addSeries({
        value: "#LINE_USAGE_C#",
        color: "#36abee",
        tooltip: {
            template: "#LINE_USAGE_C#"
        },
     });
     chart.addSeries({
        value: "#LINE_USAGE_D#",
        color: "#77ff77",
        tooltip: {
            template: "#LINE_USAGE_D#"
        },
     });
     chart.addSeries({
         value: "#LINE_USAGE_E#",
         color: "#000000",
         alpha: 0.5,
         tooltip: {
             template: "#LINE_USAGE_E#"
         },
    });

    chart.load(datafile);
}
And here’s a sample of what the data looks like (shortened):
<data>
    <item id='0'>
        <LINE_USAGE_C>1709623.0</LINE_USAGE_C>
        <LINE_USAGE_E>12446153.0</LINE_USAGE_E>
        <LINE_USAGE_D>0.0</LINE_USAGE_D>
        <LINE_USAGE_B>524288.0</LINE_USAGE_B>
        <LINE_USAGE_A>2097152.0</LINE_USAGE_A>
    </item>
    <item id='1'>
        <LINE_USAGE_C>1716459.0</LINE_USAGE_C>
        <LINE_USAGE_E>12439317.0</LINE_USAGE_E>
        <LINE_USAGE_D>0.0</LINE_USAGE_D>
        <LINE_USAGE_B>524288.0</LINE_USAGE_B>
        <LINE_USAGE_A>2097152.0</LINE_USAGE_A>
    </item>
    ...
</data>
Hi,
we have not reproduced the problem with the latest chart version. Please take a look at the attached demo.chart.zip (83.3 KB)
oazizi
October 10, 2012, 12:21am
#5
Hi Alexandra,
Thanks for taking a look at this. Please use the following XML data instead and I think you’ll be able to see the issue.
<data>
    <item id='0'>
        <SAMPLE>0</SAMPLE>
        <LINE_USAGE_B>524288.0</LINE_USAGE_B>
        <LINE_USAGE_A>2097152.0</LINE_USAGE_A>
        <LINE_USAGE_C>1709623.0</LINE_USAGE_C>
        <LINE_USAGE_E>12446153.0</LINE_USAGE_E>
        <LINE_USAGE_D>0.0</LINE_USAGE_D>
    </item>
    <item id='1'>
        <SAMPLE>1</SAMPLE>
        <LINE_USAGE_B>524288.0</LINE_USAGE_B>
        <LINE_USAGE_A>2097152.0</LINE_USAGE_A>
        <LINE_USAGE_C>1716419.0</LINE_USAGE_C>
        <LINE_USAGE_E>12439357.0</LINE_USAGE_E>
        <LINE_USAGE_D>0.0</LINE_USAGE_D>
    </item>
    <item id='2'>
        <SAMPLE>2</SAMPLE>
        <LINE_USAGE_B>524288.0</LINE_USAGE_B>
        <LINE_USAGE_A>2097152.0</LINE_USAGE_A>
        <LINE_USAGE_C>1708893.0</LINE_USAGE_C>
        <LINE_USAGE_E>12446883.0</LINE_USAGE_E>
        <LINE_USAGE_D>0.0</LINE_USAGE_D>
    </item>
    <item id='3'>
        <SAMPLE>3</SAMPLE>
        <LINE_USAGE_B>524288.0</LINE_USAGE_B>
        <LINE_USAGE_A>2097152.0</LINE_USAGE_A>
        <LINE_USAGE_C>1710169.0</LINE_USAGE_C>
        <LINE_USAGE_E>12445607.0</LINE_USAGE_E>
        <LINE_USAGE_D>0.0</LINE_USAGE_D>
    </item>
    <item id='4'>
        <SAMPLE>4</SAMPLE>
        <LINE_USAGE_B>524288.0</LINE_USAGE_B>
        <LINE_USAGE_A>2097152.0</LINE_USAGE_A>
        <LINE_USAGE_C>1713172.0</LINE_USAGE_C>
        <LINE_USAGE_E>12442604.0</LINE_USAGE_E>
        <LINE_USAGE_D>0.0</LINE_USAGE_D>
    </item>
    <item id='5'>
        <SAMPLE>5</SAMPLE>
        <LINE_USAGE_B>524288.0</LINE_USAGE_B>
        <LINE_USAGE_A>2097152.0</LINE_USAGE_A>
        <LINE_USAGE_C>1713337.0</LINE_USAGE_C>
        <LINE_USAGE_E>12442439.0</LINE_USAGE_E>
        <LINE_USAGE_D>0.0</LINE_USAGE_D>
    </item>
    <item id='6'>
        <SAMPLE>6</SAMPLE>
        <LINE_USAGE_B>524288.0</LINE_USAGE_B>
        <LINE_USAGE_A>2097152.0</LINE_USAGE_A>
        <LINE_USAGE_C>1712223.0</LINE_USAGE_C>
        <LINE_USAGE_E>12443553.0</LINE_USAGE_E>
        <LINE_USAGE_D>0.0</LINE_USAGE_D>
    </item>
    <item id='7'>
        <SAMPLE>7</SAMPLE>
        <LINE_USAGE_B>524288.0</LINE_USAGE_B>
        <LINE_USAGE_A>2097152.0</LINE_USAGE_A>
        <LINE_USAGE_C>1723178.0</LINE_USAGE_C>
        <LINE_USAGE_E>12432598.0</LINE_USAGE_E>
        <LINE_USAGE_D>0.0</LINE_USAGE_D>
    </item>
    <item id='8'>
        <SAMPLE>8</SAMPLE>
        <LINE_USAGE_B>524288.0</LINE_USAGE_B>
        <LINE_USAGE_A>2097152.0</LINE_USAGE_A>
        <LINE_USAGE_C>1721337.0</LINE_USAGE_C>
        <LINE_USAGE_E>12434439.0</LINE_USAGE_E>
        <LINE_USAGE_D>0.0</LINE_USAGE_D>
    </item>
</data>
Thanks,
Hi,
please try to use attached library instead of the original. It will solve the problem.libs.zip (68.1 KB)
oazizi
October 10, 2012, 7:05pm
#7
Looks great now. Thank you!