One of the biggest things needed in our business is the ability to present a lot of data in an easy to read format, aka a graph of some sort. Your software does this perfectly, with the ability to edit parameters to tweak the graph just the way the big wigs…end users want them.
The problem: They want to copy the image to save it as a jpeg or pdf so they can present them in a powerpoint presentation or a report.
Is there an easy to use method to save the graph as an image or a pdf?
And another issue with the legend.
chart.define("legend",{
					width: 575,
					align:'center',
					valign:'middle',
					marker:{
						type:"round"
					},
					values:[
						{text:"Planned",color:"#004B85"},
						{text:"Completed",color:"#A3AF07"},
						{text:"Total This Week",color:"#6D87A8"},
						{text:"Deleted",color:"#702342"}
					]
				});
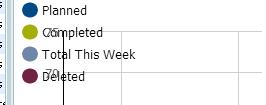
Yet the legend is displayed one line at a time from the top left corner and is overlaying the graph (see attached). I would just like it to be centered on the top or the bottom of the graph.
var canvas = chart.getCanvas().canvas;
var img = canvas.toDataURL("image/png");
console.log(img);
will log what appears to be an image into chrome console, but when copied and pasted, there is no image displayed as a png. Also does not prompt where to save the data, just creates a variable img.
And another issue with the legend.
align:‘center’ and valign:‘middle’ can not be used together.
Try to use:
align:‘center’ and valign:‘bottom’
or
align:‘right’ and valign:‘middle’
They want to copy the image to save it as a jpeg or pdf so they can present them in a powerpoint presentation or a report
Chart labels won’t be shown in this image, as labels are not part of the canvas and they are represented by absoluted positioned divs. Therefore, I think that saving canvas of Chart as an image doesn’t make sense.
However, if you want to save at least graphs, you may try use toDataURL and send to the server where the data will be processed. The following will create the image using the dataurl:
var canvas = chart.getCanvas().canvas;
var dataURL= canvas.toDataURL(“image/png”);
var img = document.createElement(“img”);
img.src = dataURL;
Moreover, you may search ready libraries in the Internet, for example nihilogic.dk/labs/canvas2image/.
Unfortunately, we can not provide a good solution for chart saving. But we will necessary consider this idea for future versions.