Hi,
I try to initiate a chart object like this:
var pieRevenueChart= new dhtmlXChart(
{ 'view':'bar',
 'value':'#yearsales#',
 'container':'pieRevenueChart',
 'label':'#bike#',
 'radius':0,
 'preset':'alpha',
 'xAxis':{'template':'#bike#'},
 'yAxis':{'title':'Sales per Bike'}});

pieRevenueChart.load("/planlogiq/index.php/CustomerAction/ajaxJSONpiechartbikes?period_id=1&fact_id=-1","json");
the json looks like this:
[{"id":"1936","yearsales":"50000.00","bike":"CVO"},
{"id":"2011","yearsales":"24400.00","bike":"Dyna"},
{"id":"2086","yearsales":"15400.00","bike":"Sportster"},
{"id":"2161","yearsales":"31000.00","bike":"V-Rod"},
{"id":"2236","yearsales":"38000.00","bike":"Touring"},
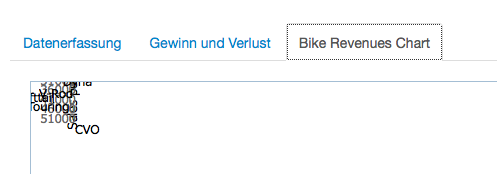
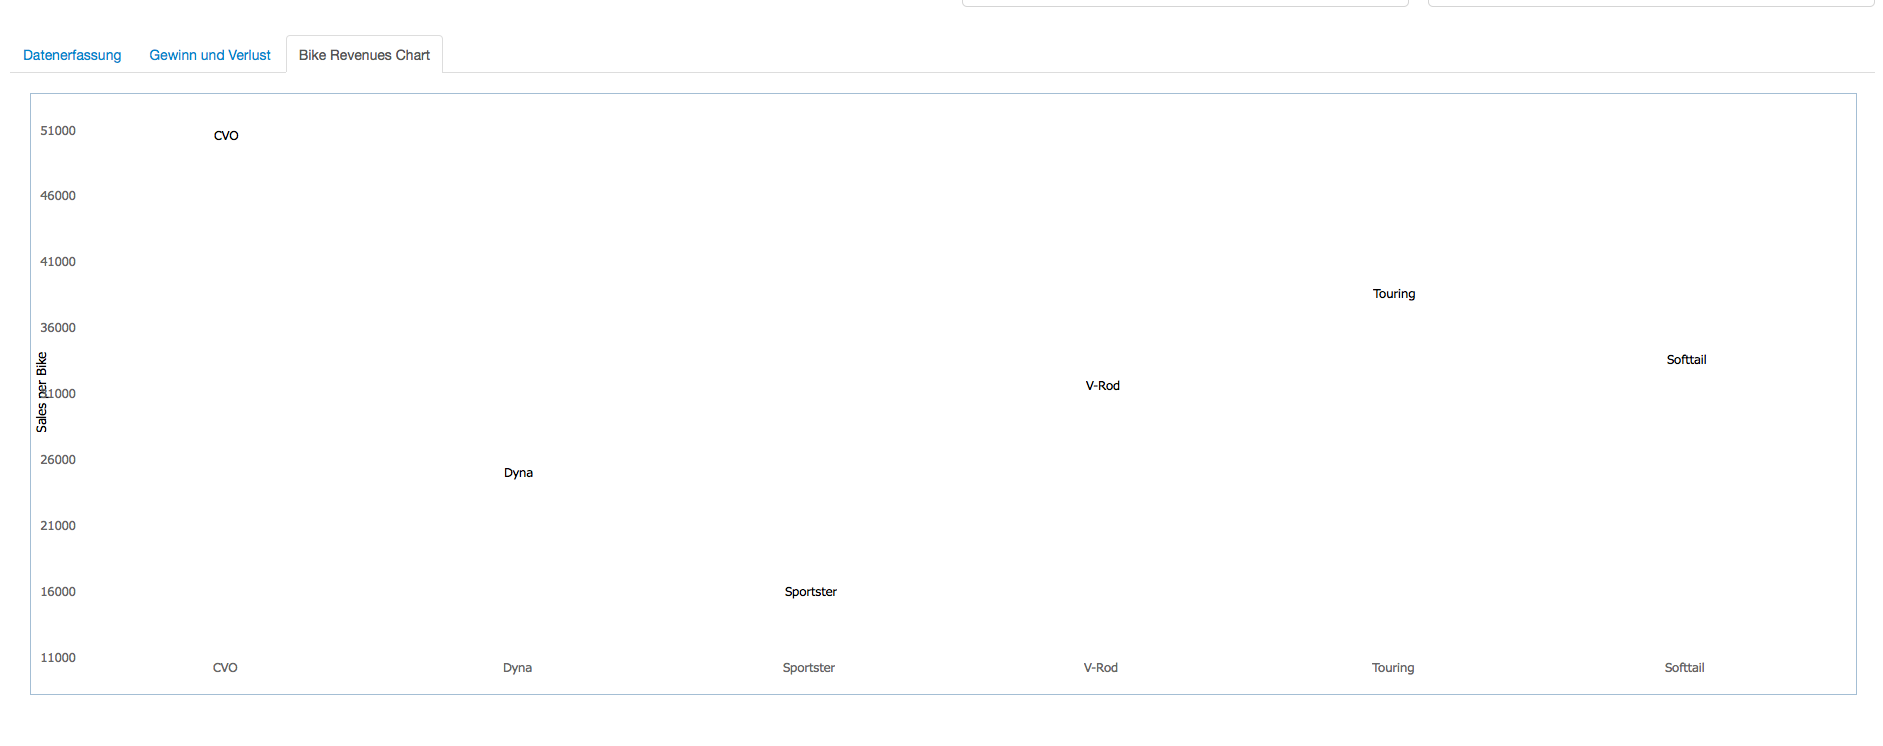
{"id":"2311","yearsales":"33000.00","bike":"Softtail"}]With the first load, the chart displays no values. On a manual refresh, I see labels in the upper left of the chart div on a third refresh, i see the chart without bars:(
Pls. can you help me with this issue? Thanks!