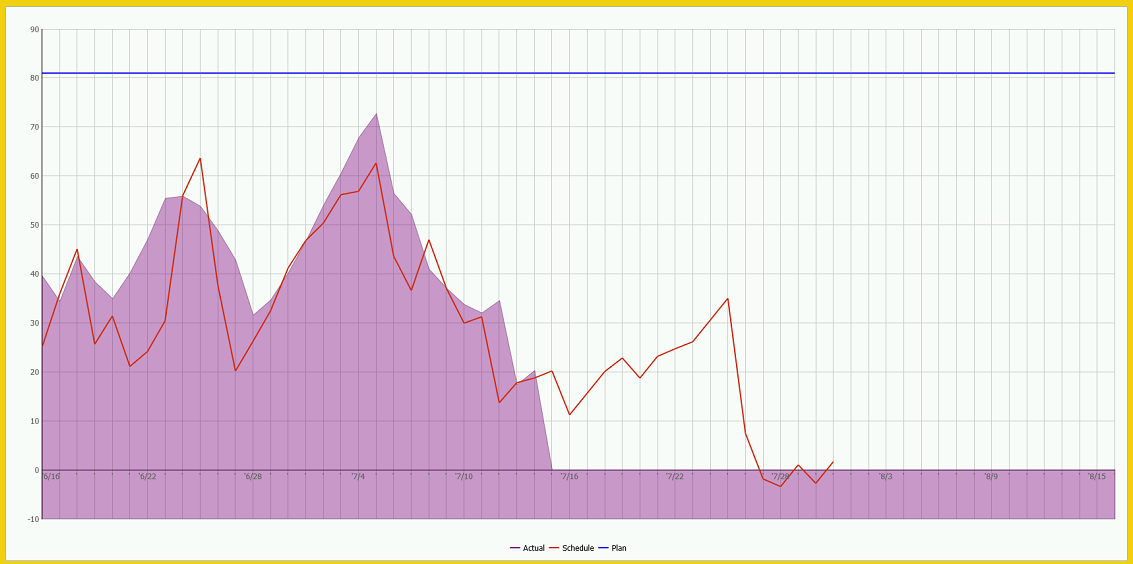
I have tried supply “null” value into the chart: line/spline. It works fine, I can see the line cut off when there is “null” value supplied.
The same data, can’t work correctly in area type, it will just render the area until the x axis stop.
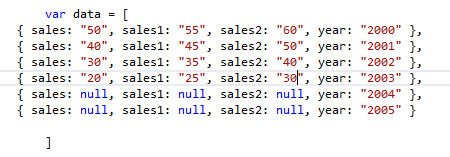
My data:
The chart:
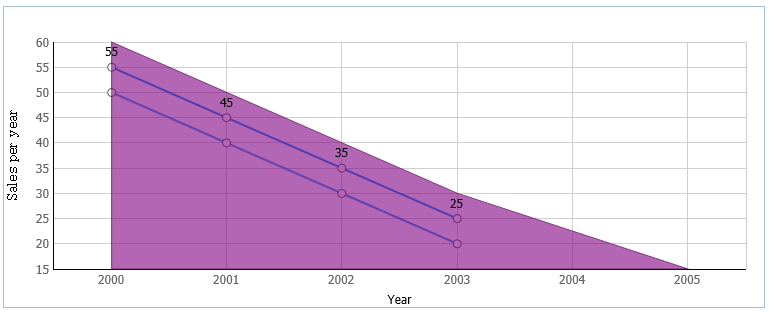
Expectation:
I would expect the area type would cut off at the year of 2003. Should it be the way? Thanks, please help.