I am using the professional version of dhtmlX api. My question relates to dhtmlXChart:
My dataset consists of 2 columns: #column1# & #column2#
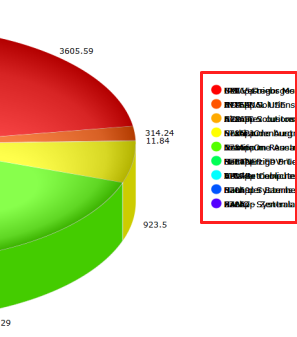
Based on user input (radio-button), I need to construct my dhtmlXChart (pie chart 3D) in following manner:
if(radio-button-1.checked)
{
pieChart3D = new dhtmlXChart({
view: “pie3D”,
container: “chart”, value: “#column1#”,
legend:{
width: 155,
align: “left”,
valign: “bottom”,
marker:{
type: “square”,
width: 15
},
template: “#industryName#”
},
tooltip:{
template:function(obj) { var column1 = obj.column1; var sum = pieChart3D.sum(“#column1#”); var percent = Math.round(column1/sum*100) +“%”; return column1 + " ; " + percent;
}
},
pieInnerText:function(obj){ var column1 = obj.column1;
var sum = pieChart3D.sum(“#column1#”);
var percent = Math.round(column1/sum*100) +“%”;
return column1 + " ; " + percent;
}
});
}
else if (radio-button-2.checked)
{
pieChart3D = new dhtmlXChart({
view: “pie3D”,
container: “chart”, value: “#column2#”,
legend:{
width: 155,
align: “left”,
valign: “bottom”,
marker:{
type: “square”,
width: 15
},
template: “#industryName#”
},
tooltip:{
template:function(obj) { var column2 = obj.column2; var sum = pieChart3D.sum(“#column2#”); var percent = Math.round(column2/sum*100) +“%”; return column2 + " ; " + percent;
}
},
pieInnerText:function(obj){ var column2 = obj.column2;
var sum = pieChart3D.sum(“#column2#”);
var percent = Math.round(column2/sum*100) +“%”;
return column2 + " ; " + percent;
}
});
}
Now the issue that I’m facing is that I’m unable to reconstruct the variable pieChart3D. After constructing the variable pieChart3D, when I try to reconstruct it again, the pieChart disappears. I don’t understand why this is happening…
Kindly tell me how can I achieve the desired functionality.
sorry for my late feedback. It works now - thank you!
One last question: Is it possible, that when initializing the chart component from a grid, which has paging activated and multiple pages as data source, the chart doesn´t initialize?
I ask, because i have this problem…
Additional Info: Chart component initializes well, if i click all grid pages through before creating the chart. Maybe this helps for your analyses…