Hi, Forgive me, but I’m new to the control. I’m trying to quickly determine if it will fit some specific needs. I hope someone can help.
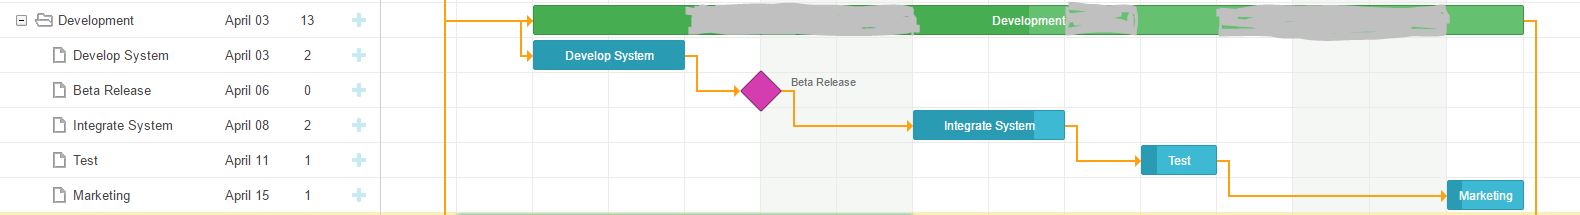
I need to be able to visualize all of the task duration for a given day at the Project level (when tasks are collapsed in the tree view) including a visualization of the time where no tasks are active. In other words if I have two tasks and they do not overlap and there is an hour break between them I would like to see that break in the colored band used to represent the Project type.
The objective here is to take about 100 “projects” that have n number of sub tasks and quickly visualize with the chart collapsed to show just Projects where we have open time or time where there are no tasks planned.
Is it possible?
Thanks.