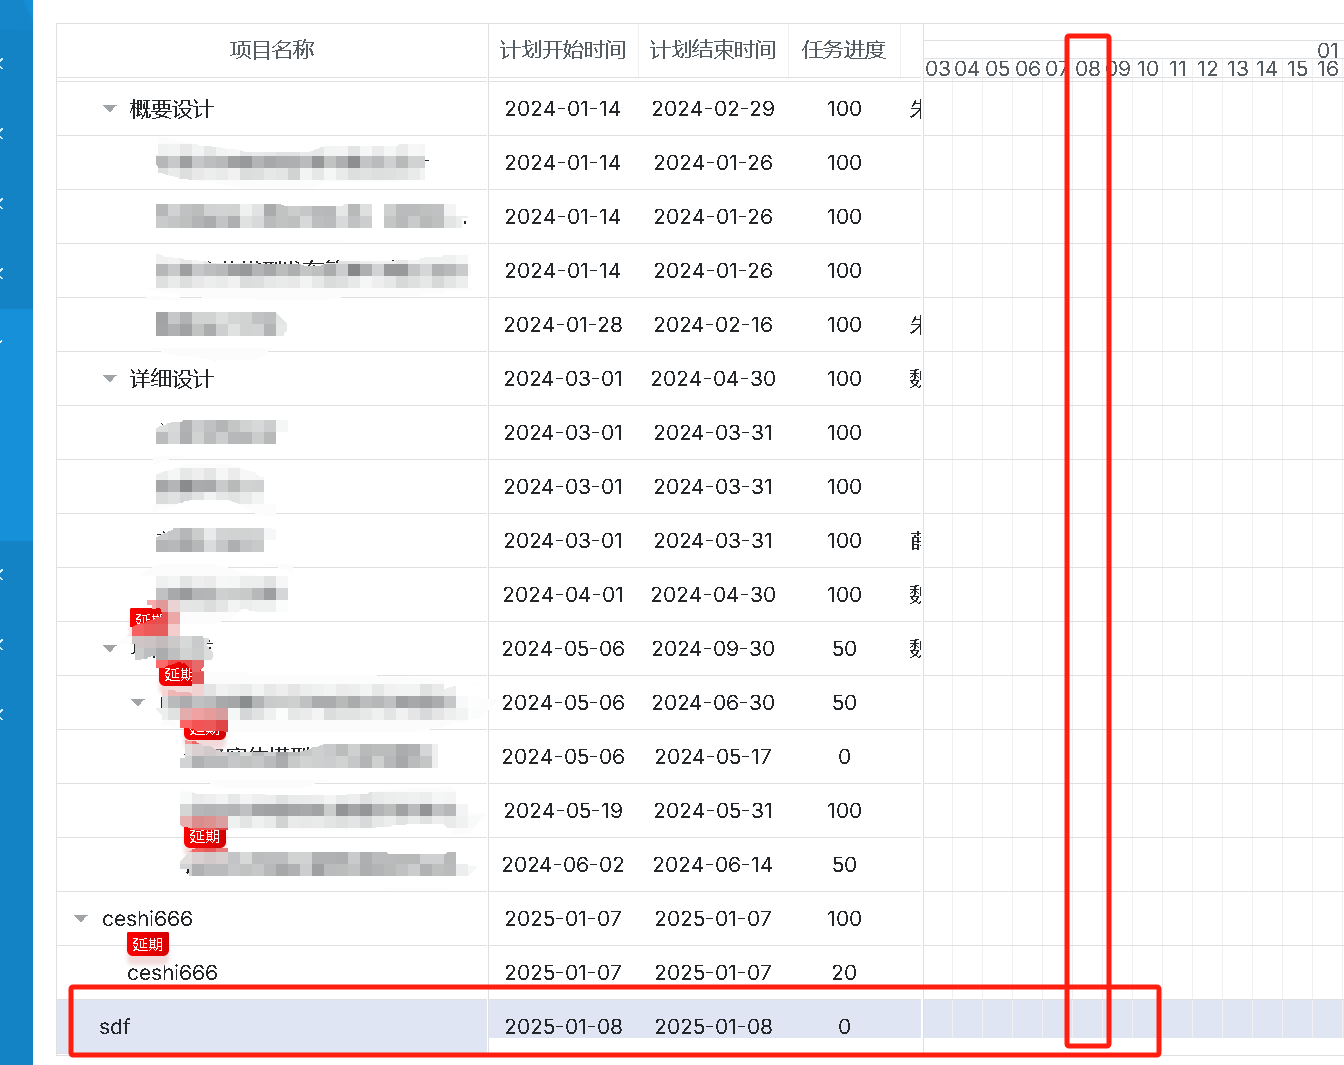
Hello, as you can see here I am on the 8th day, I think it is only right that I should show a grid of content on the progress bar, but there is not even a progress bar in the Gantt chart, how should I set the progress bar up
Hello,
Unfortunately, your question is not clear to me. Could you please provide more details about the issue? It would also be very helpful if you could share a test demo. You can reproduce it here: DHTMLX Snippet Tool and send it over.
// ----JavaScript
let columns = [
     {name: 'text', label: '任务名称', min_width: 100, align: "center"},
        {name: 'start_date', label: '计划开始时间', min_width: 100, align: "center"},
        {name: 'end_date', label: '计划结束时间', min_width: 100, align: "center"},
    ]

    // 基础配置
gantt.clearAll() // 清空之前的配置
gantt.i18n.setLocale('cn'); // 设置中文
gantt.config.readonly = true; // 设置为只读,否则是可以移动甘特图和连线的

gantt.config.order_branch = "marker";

gantt.config.scroll_size = 10;
gantt.config.autosize = false;
gantt.config.fit_tasks = true;
gantt.config.xml_date = "%Y-%m-%d"
gantt.config.sort = true;
gantt.config.columns = columns;
gantt.config.scales = [
        {unit: 'year', step: 1, format: '%Y'},
        {unit: 'month', step: 1, format: '%m'},
        {unit: 'day', step: 1, format: '%d'}
    ];

gantt.config.tooltip_offset_x = 10;
gantt.config.tooltip_offset_y = 30;

gantt.config.drag_mode = {}

gantt.config.drag_project = true

gantt.config.min_column_width = 20;
gantt.config.autofit = true;

gantt.config.show_links = false;
gantt.init("gantt_here");
//Please focus on the data used
let res = {data:[{text:"test1",start_date:"2025-01-01",end_date:"2025-01-01"}]}
gantt.parse(res);

// --HTML
<div id="gantt_here" class="gantt" style="height:60vh"></div>
Hello, I’m sorry for not letting you understand my question, you can copy my code and use it, you will find that there is no content in the Gantt chart on the right side of 2025-01-01 to 2025-01-01, it may be due to regional reasons, I’m using it in China, and here in our country 2025-01-01 to 2025-01-01 represents a day’s work, you can understand that it is the same as 2025-01-01 00:00:00 to 2025-01-01 23:59:59, I would like to have a content display in the right side of the gantt chart 2025-01-01 this day, but it seems that there is not. 01 00:00:00 to 2025-01-01 23:59:59,I would like to have a content on the right side of the Gantt chart for the day 2025-01-01,but it seems not to be there,I need your help urgently,can you understand it,thank you very much for your reply!
Hello,
The issue occurs because gantt.config.xml_date = "%Y-%m-%d" does not account for hours and minutes. For a task like { text: "test1", start_date: "2025-01-01", end_date: "2025-01-01" }, Gantt calculates the duration as 0, so the task is not displayed.
You can find more details in this article:
Task End Date Display & Inclusive End Dates
It’s worth noting that xml_date is deprecated, and you should use date_format instead. Configure it to include hours and minutes like this:
gantt.config.date_format = "%Y-%m-%d %H:%i";
Also, make sure to specify hours and minutes in your task definition:
{ text: "test1", start_date: "2025-01-01 00:00", end_date: "2025-01-01 23:59" }
Here’s an example: DHTMLX Snippet Tool
It’s important to mention that storing a task with start_date: "2025-01-01 00:00" and end_date: "2025-01-01 23:59" as a single workday can affect duration calculations and auto-scheduling. It’s better to use the recommended format for a 1-day task:
start_date: "2025-01-01 00:00", end_date: "2025-01-02 00:00"
You can read more about this here:
How Gantt Stores Task End Dates
