Good morning!
I’m working with the Chart object. Only I’m having problems when upgrading.
When I go from one graph to another, it does not clear and draws a graph on top of another.
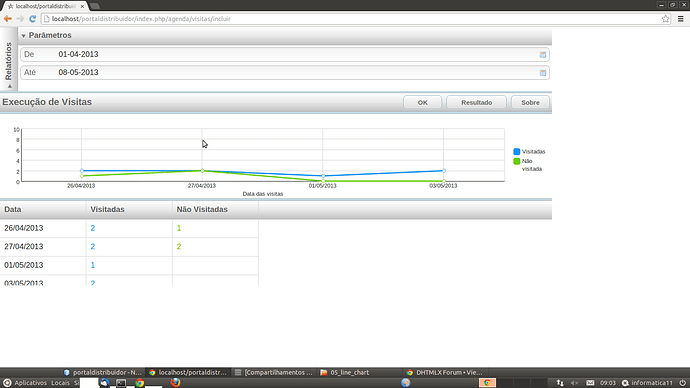
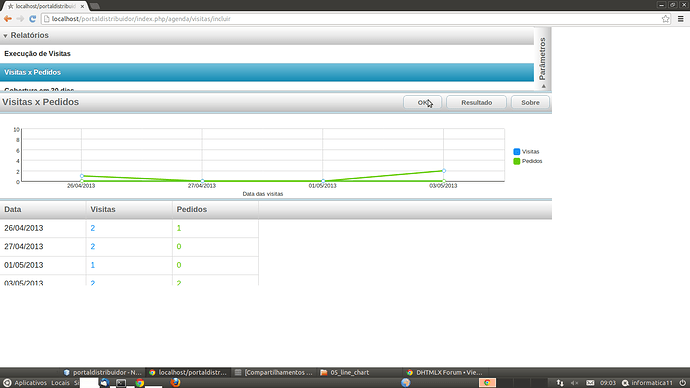
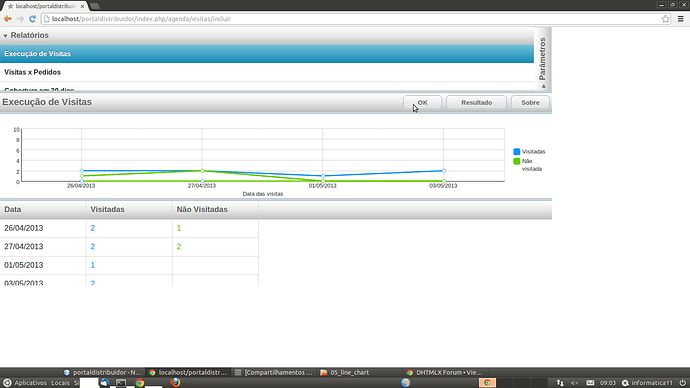
See the pictures.
This is the first chart that appears correctly.
This is a second chart that appears correctly too.
When you return in the first graph, it does not clear the first and overwrites the graph.
//Defining object chart in view
//Gráfico
{ view: ‘chart’,
scroll: true,
item: { borderColor: ‘#1293f8’},
xAxis: { title: ’ ', template: ’ ', lines: true},
yAxis: { title: ‘’, lines: true, template: ’ '},
id: ‘grafico’, datatype: ‘json’, url: ‘’
},
//Udpating object chart for each chart
$$(‘grafico’).clearAll();
$$(‘grafico’).define(“type”,“line”);
$$(‘grafico’).define(“url”,“…/visitas/relExecucaoVisitas?dtIni=”+dataI +“&dtFin=”+dataF);
$$(‘grafico’).define(“xAxis”,eixoX);
$$(‘grafico’).define(“yAxis”,eixoY);
$$(‘grafico’).define(“legend”,legenda);
$$(‘grafico’).define(“eventRadius”,“5”);
$$(‘grafico’).define(“series”,SeriesExecVisit);
$$(‘grafico’).define(“preset”,“plot”);
$$(‘grafico’).refresh;
I’m not getting clean and updated the object again.
I could not use the destructor method and create the object in view again.
I hope you can help me.
Thank you.


