I have a requirement that on an ajax call , I need to refresh chart values including Y axis scale.
I tried following which changes the scale values but rest of graph values disappear :-
<script src="dhtmlxChart/codebase/dhtmlxchart.js" type="text/javascript"></script>
<link rel="STYLESHEET" type="text/css" href="dhtmlxChart/codebase/dhtmlxchart.css">
<script src="dhtmlxChart/samples/common/testdata.js"></script>
<script>
var lineChart ;
window.onload = function(){
lineChart = new dhtmlXChart(
{ 'view':'line',
'value':'#yearsales#',
'container':'lineChart',
'label':'#bike#',
'radius':0,
'preset':'alpha',
'xAxis':{'template':'#bike#'},
'yAxis':{'title':'Sales per Bike'}});
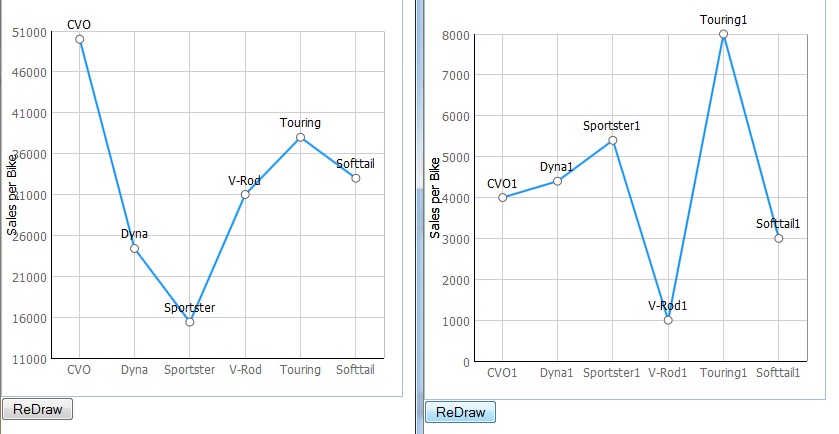
dataset = [{"id":"1936","yearsales":"50000.00","bike":"CVO"},
{"id":"2011","yearsales":"24400.00","bike":"Dyna"},
{"id":"2086","yearsales":"15400.00","bike":"Sportster"},
{"id":"2161","yearsales":"31000.00","bike":"V-Rod"},
{"id":"2236","yearsales":"38000.00","bike":"Touring"},
{"id":"2311","yearsales":"33000.00","bike":"Softtail"}]
lineChart.parse(dataset,"json");
}
function replace(){
lineChart.clearAll();
lineChart = null;
lineChart= new dhtmlXChart(
{ 'view':'line',
'value':'#yearsales#',
'container':'lineChart',
'label':'#bike#',
'radius':0,
'preset':'alpha',
'xAxis':{'template':'#bike#'},
'yAxis':{'title':'Sales per Bike'}});
dataset = [{"id":"1936","yearsales":"4000.00","bike":"CVO1"},
{"id":"2011","yearsales":"4400.00","bike":"Dyna1"},
{"id":"2086","yearsales":"5400.00","bike":"Sportster1"},
{"id":"2161","yearsales":"1000.00","bike":"V-Rod1"},
{"id":"2236","yearsales":"8000.00","bike":"Touring1"},
{"id":"2311","yearsales":"3000.00","bike":"Softtail1"}]
lineChart.parse(dataset,"json");
lineChart.refresh();
}
</script>
<td><div id="lineChart" style="width:400px;height:400px;border:1px solid #A4BED4;"></div></td>
<td><input type="button" value="ReDraw" onclick="replace()" /> </td>
</body>