Replace Y-axis values

Hi can i replace Y-axis title value ???

i have same json

[{“alex_student_id”:“5”,“alex_student_name”:“alex”,“tony_student_id”:“6”,“tony_student_name”:“tony”,“time”:“1”},{“alex_student_id”:“5”,“alex_student_name”:“alex”,“tony_student_id”:“6”,“tony_student_name”:“tony”,“time”:“2”}]

i have two charts with value:“#alex_student_id#” and value:“#tony_student_id#”
start:0,
end:10,
step:1

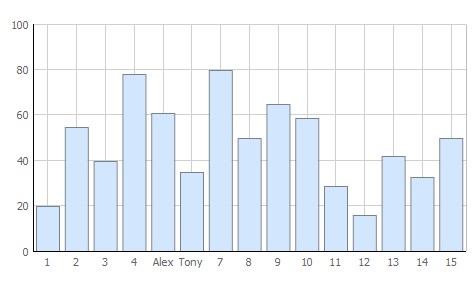
Y-axis have values 0,1,2,3,4,5,6,7,8,9,10 can i replace this id by alex_student_name and tony_student_name
that Y-axis have values 0,1,2,3,4,alex,tony,7,8,9,10

Hi
You can do be analogy with the next code sample:

dataset = [ { id:1, sales:20, year:"1"}, { id:2, sales:55, year:"2"}, { id:3, sales:40, year:"3"}, { id:4, sales:78, year:"4"}, { id:5, sales:61, year:"5"}, { id:6, sales:35, year:"6"}, { id:7, sales:80, year:"7"}, { id:8, sales:50, year:"8"}, { id:9, sales:65, year:"9"}, { id:10, sales:59, year:"10"}, { id:11, sales:29, year:"11"}, { id:12, sales:16, year:"12"}, { id:13, sales:42, year:"13"}, { id:14, sales:33, year:"14"}, { id:15, sales:50, year:"15"} ]; barChart1 = new dhtmlXChart({ view:"bar", container:"chart1", color: "#d2e7fe", value:"#sales#", barWidth:35, radius:0, xAxis:{ template: function(obj){ if(obj.id == 5)return "Alex"; if(obj.id == 6)return "Tony"; return obj.year; } }, yAxis:{ start:0, end:100, step:20} }); barChart1.parse(dataset,"json");
Result:


If you have difficulties, provide us the whole chart structure with init - we will help you based on your code

thank you that’s enough

You are welcome!