Hi. I found some discussions related to the millis subject, but it does not really cover my requirement. I know it is not natively supported like minutes.
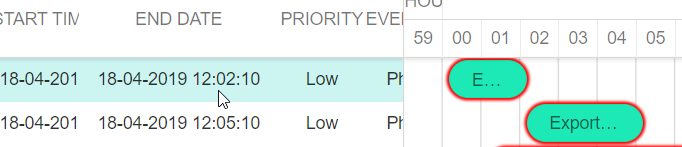
I do not want a scale, all I want is to save that data and display it on the overview tab, like in the pic below: .
I’ve configured a custom date picker to accomodate this, but I am not able to read or save the millis in the backed. Is there any way I can do this? This is very important for my requirement, I repeat, I only need to save that data and show it in the overview panel.
Hello Emilian,
Although there is a way to display milliseconds in the grid, there is no built-in way to save it.
When you drag a task, it snaps to the nearest timeline cell border. If you disable the round_dnd_dates option, the task will snap to the time_step unit. As even the second scale is not supported, the task will snap to the nearest minute: http://snippet.dhtmlx.com/5/3071951bc
However, there is a workaround. You can save the last task dates in the temporary properties and restore them via an API call after you finished dragging the task: http://snippet.dhtmlx.com/5/f4b642d9c
The task objects use the Date object for the date parameters, so you can store these dates from the task parameters with milliseconds on the server.
It seems I have a pretty problematic issue, save and display works fine but when I import the data, it does not load the millis. What could I do to fix this? I tried to work with different time formats, no luck. The solution is pretty much irrelevant if I cannot import it. Thank you!
Hello Emilian,
You need to manually modify the task objects via Javascript after loading the task data.
Here is an example of how to do that: http://snippet.dhtmlx.com/5/a461422a1
Get a guaranteed answer from DHTMLX technical support team
under the most suitable support plan
 .
.