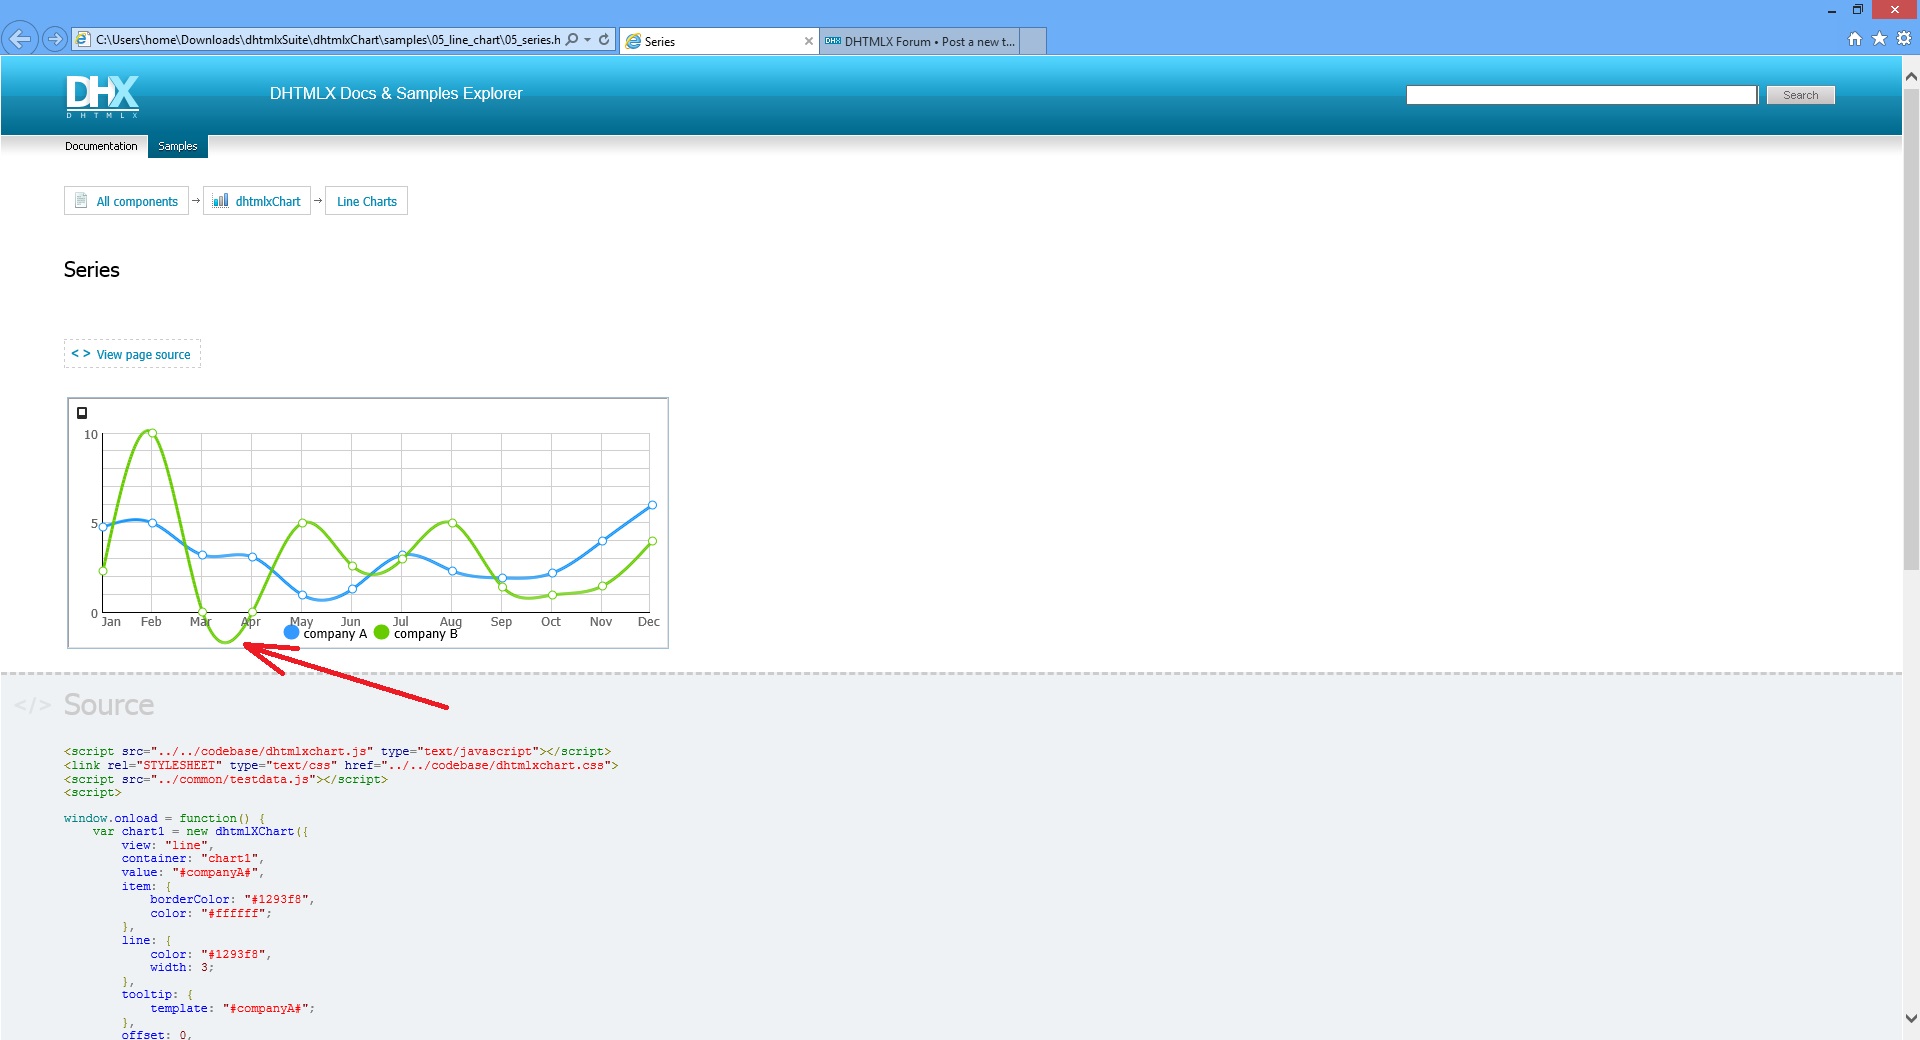
Hi when I use type spline on my chart, if value close to 0 or equal 0, than line on graph shows under the xAxis, how I can solve this ? ? for example, that the line was on 0 but not under 0.
I use scale (0-100%) on the Yaxis and when the line shows under 0 it looks impossible
this is data which used by chart on screenshot
var companies=[
    { "companyA":"4.8", "companyB":"2.3", "month":"Jan" },
    { "companyA":"5.0", "companyB":"12.1", "month":"Feb" },
    { "companyA":"3.2", "companyB":"0.0", "month":"Mar" },
    { "companyA":"3.1", "companyB":"0.0", "month":"Apr" },
    { "companyA":"1.0", "companyB":"5.0", "month":"May" },
    { "companyA":"1.3", "companyB":"2.6", "month":"Jun" },
    { "companyA":"3.2", "companyB":"3.0", "month":"Jul" },
    { "companyA":"2.3", "companyB":"5.0", "month":"Aug" },
    { "companyA":"1.9", "companyB":"1.4", "month":"Sep" },
    { "companyA":"2.2", "companyB":"1.0", "month":"Oct" },
    { "companyA":"4.0", "companyB":"1.5", "month":"Nov" },
    { "companyA":"6.0", "companyB":"4.0", "month":"Dec" }
];