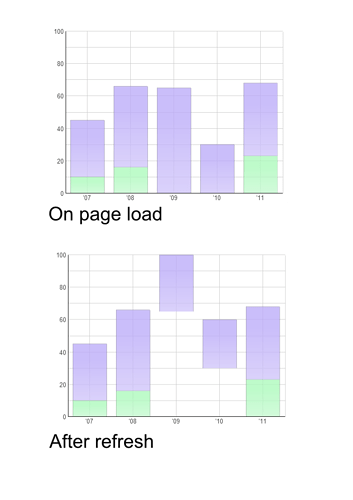
I am encountering a problem after a refresh() with the stackedBar chart when there are 0 values in the 1st series.
Bars with a 0 in the 1st series are redrawn with their Y value starting at the max value of the bar max value.
Please see the attached .png with screen shots.
My test is based on your example: dhtmlx.com/touch/samples/07_ … d_xml.html
Added a series: to the xml_data
var data_xml = “1035'071650'08065'09030'102345'11”;
And changed js to:
iew:“chart”,
id: “chart_test1”,
type:“stackedBar”,
radius:0,
alpha:0.5,
border:true,
barWidth:70,
xAxis:{
template:“#year#”
},
yAxis:{
start:0,
end:100,
step:10,
template:function(obj){
return (obj%20?“”:obj)
}
},
series: [
{value:“#sales0#”,gradient:“falling”,color:“#a8f9b9”},
{value:“#sales#”,gradient:“falling”,color:“#b9a8f9”}
],
datatype:“xml”,
data: data_xml
