We need to be able to view task resource usage as a histogram at the bottom of the Gantt chart. Then each task can have a property that could be accumulated in the histogram.
Similar to this:
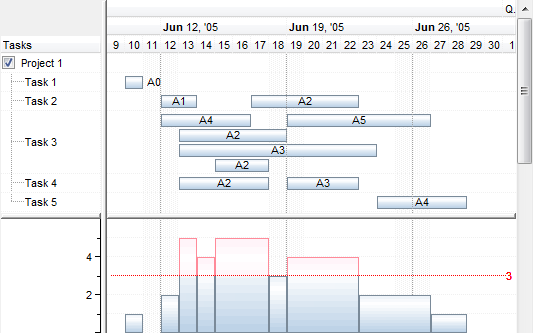
I understand that a resource view is scheduled in the Gantt chart roadmap, but I’m not sure if the histogram is covered by that feature.