using stacked barH horiz bar chart that otherwise works, when I allow values over 100 (%) then the x axis values change
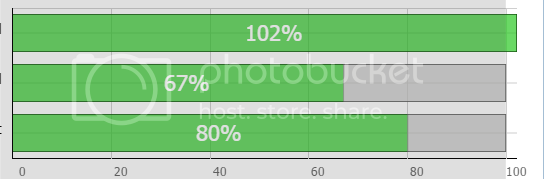
I had logic to clamp the value to 100 % but found it needs to reflect either the true value or have some way to show its past 100%. right now on one if the first charts value is 102? then the horiz x axis starts at -2 and ends at 98 ??
there are 3 bars it would be nice if it just scales as they all start at zero % and the number is right, so if we have 102, 80 and 67 it needs to always start the chart at 0 but at least end on some even number, or end on the 5’s 95/100/105/110/115 etc and not end at 98?
its a great control, but any ideas on this are greatly appreciated
Hello,
could you please provide a sample code for the problem ?
[code] myBarChart = new dhtmlXChart({
multiline: true,
view: “stackedBarH”,
container: “chartDiv”,
value: “#spent#”,
label: function (obj) {
if (obj.rname == "Remaining" && timeused > 100 ) {
return "<span style='font-size:22px; color: red'>" + obj.spent + "%" + "</span>";
}
return "<span style='font-size:22px; color: white'>" + obj.spent + "%" + "</span>";
},
color: "#5ac923",
width: 38,
alpha: 0.7,
xAxis: {
start: 0,
step:20,
end: 100
},
padding: {
left: 250,
right: 18,
},
yAxis: {
template: function (obj) {
return "<p style='font-size:14px;color:black;'>" + obj.rname + "</p>" + " ";
}
}
});
myBarChart.addSeries({
value: "#rrmain#",
color: "#c5c6c4",
label: ""
});
my_data = [{ spent: Remaining, rrmain: quotient1, rname: "Elapsed " },
{ spent: Itemcompl, rrmain: quotient2, rname: "Estimate of Items Complete " },
{ spent: Moneyspent, rrmain: quotient3, rname: "Money Spent " }];
myBarChart.parse(my_data, "json");[/code]
the scaling problem comes from adding a 2nd series, which was in the requirement to show the chart value against a grey background the length of the chart
update: it still wont work. the logic to find the largest of the 3 values? is arbitrary. If the 3 values are 102, 87, 80 it may find any of the 3 to be the largest number. in one use with an SQL record it works but some other one fails. will try converting in the server/backend instead.
wrong version:
  amtSpent = "40";
            total = "100";
            Remaining = "@Model.TimeElapsed";
            quotient1 = (100 - Remaining);
            Itemcompl= "@Model.ItemsCompleted";
            quotient2 = (100 - Itemcompl);
            Moneyspent = "@Model.MoneySpent";
            quotient3 = (100 - Moneyspent);
            pSpent = (1 / (total / amtSpent)) * 100;
            perSpent = Math.round(pSpent);
            Overflowed = "@Model.ItemOverdue";
Here the 2nd series is clamped to 0 if we’re over 100% Make the 2nd series 0 scales it right
  amtSpent = "40";
            total = "100";
            Remaining = "@Model.TimeElapsed";
            quotient1 =    Remaining > 99? 0: (100 - Remaining);
            Itemcompl= "@Model.ItemsCompleted";
            quotient2 = Itemcompl> 99?  0: (100 - Itemcompl);
            Moneyspent = "@Model.MoneySpent";
            quotient3 =  Moneyspent > 99?  0: (100 - Moneyspent);
            pSpent = (1 / (total / amtSpent)) * 100;
            perSpent = Math.round(pSpent);
            Overflowed = "@Model.ItemOverdue";
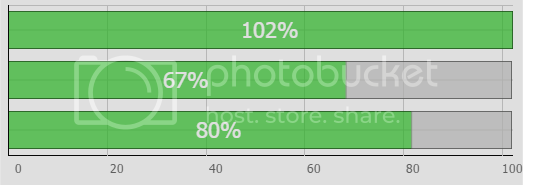
note that the one with 80% no longer falls on the 80% line, this is unusable. the bottom 2, the grey area extends past 100%, this is wrong. The top one can go past.
I guess the fix was to find the largest of the 3 numbers and use this to scale the thing, largest value = “end” value. Was tricky because of how the logic seemed backwards at first:
biggest3 = biggest1 > biggest2 ? biggest2 : biggest1;
seems like biggest 1 greater than biggest 2? yes? then use biggest 1, otherwise 2, reversed it and it discriminates right