fabero
April 25, 2014, 11:21am
#1
I obtain this:
snurl.com/28uhtvg
but why?
<!DOCTYPE html PUBLIC "-//W3C//DTD XHTML 1.0 Strict//EN" "http://www.w3.org/TR/xhtml1/DTD/xhtml1-strict.dtd">
<html xmlns="http://www.w3.org/1999/xhtml" lang="en" xml:lang="en">
<head>
<title>Test dati temperatura</title>
<meta http-equiv="content-type" content="text/html; charset=utf-8" />
<meta name="title" content="rpimetry" />
<meta name="keywords" content="" />
<meta name="description" content="" />
</head>
<body>
<h3>S3 Temperature</h3>
<div class="grafico">
<script src="../../codebase/dhtmlxchart.js" type="text/javascript"></script>
<link rel="STYLESHEET" type="text/css" href="../../codebase/dhtmlxchart.css">
<script>
    window.onload = function(){
        var chart =  new dhtmlXChart({
            view:"spline",
            container:"chartDiv",
            value:"#data0#",
            radius:0,
            border:true,
            xAxis:{
             template:"#data1#"
            },
            yAxis:{
                start:0,
                end:100,
                step:5,
                template:function(obj){
                    return (obj%20?"":obj)
                }
            }
	})
          chart.load("data.csv","csv")
    }
</script>
<div id="chartDiv" style="width:600px;height:250px;margin:20px;border:1px solid #A4BED4"></div>
</div>
</body>
</html>
And this is the content of csv file:
"90", "2007"
"73", "2008"
"76", "2009"
"95", "2010"
Any hint please? Thanks in advance!
Darya
April 25, 2014, 1:29pm
#2
Locally your sample works fine. But if you need step:20, you don’t need to set 5 and then use template. You need just set 20 at start.14.04.25.rar (85.2 KB)
fabero
April 25, 2014, 1:37pm
#3
Sorry, but I don’t understand.
I change my “script” section with yours, but nothing change…
What I mistake?
Darya
April 25, 2014, 1:55pm
#4
The reason most likely is in your csv data. Please, try to load your chart locally with my attached static csv file.
fabero
April 25, 2014, 1:57pm
#5
I put also your file, but no luck.
Locally seems to works, but not in server, so whats the matter?
Darya
April 25, 2014, 2:14pm
#6
You need to check your server script: it tries to build the last 5-th data point. But as you haven’t it, it draws this data as 0:0.
fabero
April 25, 2014, 2:17pm
#7
The script is the yours, and/or also what I’ve previously posted.
So what is my error?
Darya
April 25, 2014, 2:34pm
#8
I need to clarify some questions:
is my sample working for you locally?
is my sample working for you “under” the server?
what are your OS, browser and dhtmlx versions?
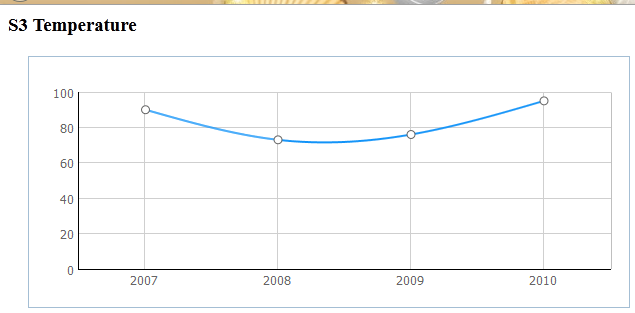
My local result:
fabero
April 25, 2014, 2:40pm
#10
Adding other information.
Opening in local with latest firefox works, but not in server.
Same with latest Safari.
Darya
April 28, 2014, 12:26pm
#11
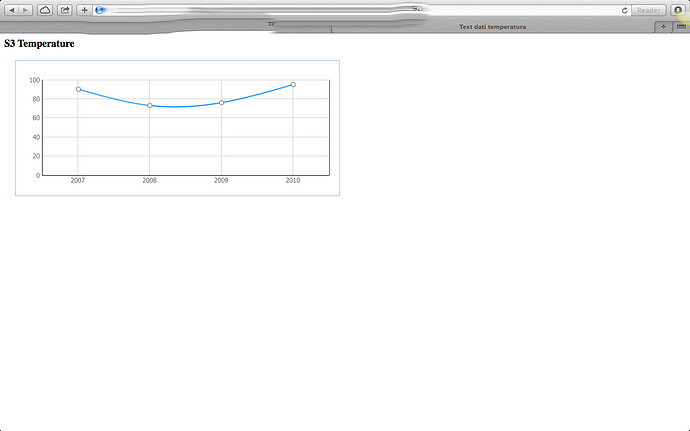
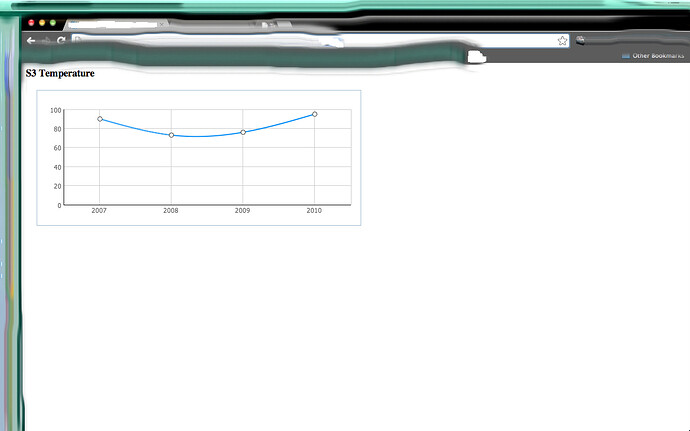
Tested locally on the same conditions: works. Screenshots are attached
fabero
April 28, 2014, 12:34pm
#12
I’m sure that from you works, but not there, so what’s the matter? What I need to check?
Darya
April 28, 2014, 12:44pm
#13
Try to check the correctness of the library pathes and theirs order…
fabero
April 28, 2014, 12:45pm
#14
I’ve posted my source html, so is incorrect?
Darya
April 28, 2014, 1:06pm
#15
We have provide you a working demo for Safari and Chrome. But we can’t see your server-side to answer this question. You have to check your server-side independently.
fabero
April 28, 2014, 1:09pm
#16
Sorry but I don’t understand.
You answer to check the permissions, but if my script was ok, and html too, what permission I need to check? Which files can produce that result?
Hello,
As you have already written, the problem happens only when you try to load the page under web server. Our library works correctly. So, you should find the problem on your side. Possibly there is something with paths to libraries or server settings. Try to check browser console. There you can see information about errors that happen on a page.
fabero
May 5, 2014, 1:43pm
#18
Sorry, but itsn’t a good answer.
I post everything, and I say what I’m using; so you can suggest effectively what to check.
I’m very disappointed, even because I wll consider to buy your software. But the support is very lacking…


