My labels say the number of records I counted for the reservation_hour.
But I need the reservation_hour as a label, and the inner label the number of records…
I tried several different things, but I can’t seem to find out how to do this.
Any hints anyone?
[code]
var myPieChart;
function doOnLoad() {
myPieChart = new dhtmlXChart({
view:“pie”,
container:“chart”,
value:“#reservation_hour#”,
label:“#reservation_hour#”,
// pieInnerText:“#reservation_hour#”,
shadow:0,
group:{
by:“#reservation_hour#”,
map:{
reservation_hour:[null,setCount]
}
},
It doesn’t work…
I tried using all the samples, but none of them have a count-function so I cannot seem to get what I need.
I need records grouped by: #reservation_hour# with also the labels of these hours. (It’s a varchar field.)
Then I need the records to be counted and show how many companies come at what hour.
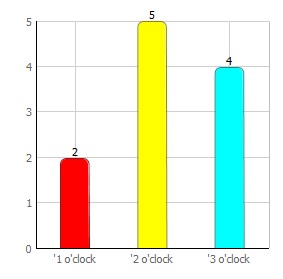
e.g.
1 'o clock : 10 companies
2 'o clock : 9 companies
3 'o clock : 14 companies
and so on. Where the amount of companies is basically the amount of records.