Whether it is possible to embed a custom histogram plug-in such as Echarts in the area that displays the resource histogram?
region as shown above.If possible, I would like to provide a case study.
Thank you.
Whether it is possible to embed a custom histogram plug-in such as Echarts in the area that displays the resource histogram?
Hello,
It depends on how you expect it to look and work.
If you want the custom chart to always be displayed, you can create a custom HTML view and add the HTML elements there:
https://docs.dhtmlx.com/gantt/desktop__layout_config.html#htmlasinnerview
Then you can initialize Echarts inside that container in the onGanttReady event handler:
https://docs.dhtmlx.com/gantt/api__gantt_onganttready_event.html
I added the code from the basic demo to the snippet, and it works correctly there:
https://snippet.dhtmlx.com/htiri1vk
Hello,
Gantt doesn’t have the dedicated event handlers for the resource panel. The dev team will add it in the future, but I cannot give you any ETA.
For now, you need to use the onEmptyClick event.
Here are examples of the implementation:
Hello! ramil
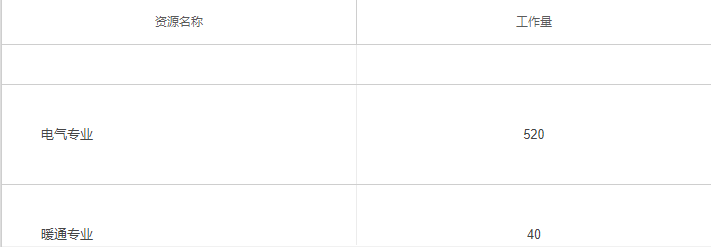
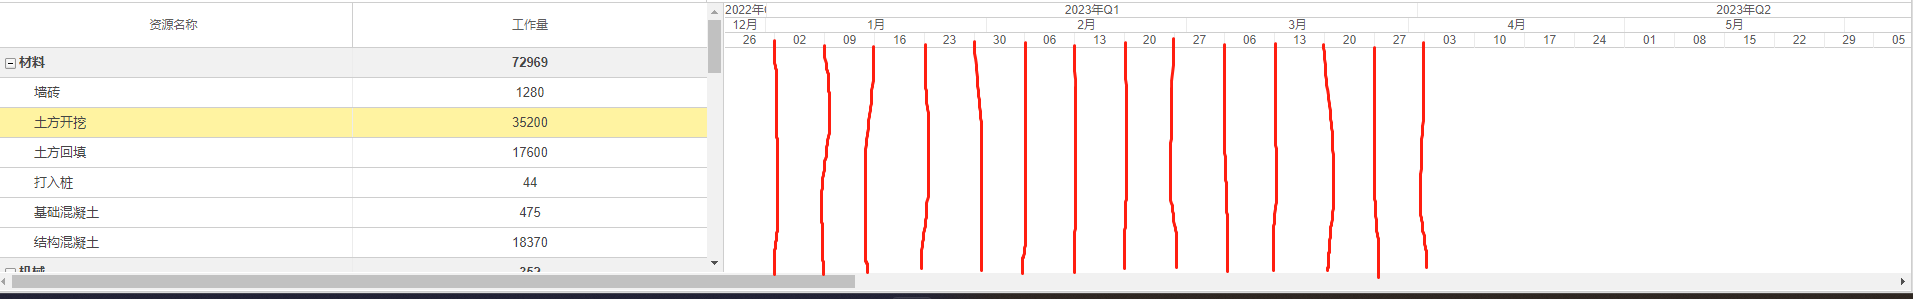
Now I have an idea, I don’t know whether gantt can be implemented. I want to display the histogram of the current resource on the right side when I click the resource, but the histogram on the right side only shows the current, that is, the histogram on the right side only has a time ruler and a grid to display the histogram of the current resource,as shown in the following figure.
Hello,
If you want to display custom content instead of the histogram timeline, you just need to change the layout configuration and add the layout view that you need.
After clicking on the resource, you need to modify the eChart data and reload it.
Here is an example of how it can be implemented:
https://snippet.dhtmlx.com/qixnimbq
First of all, I appreciate the method you provided, but I want to customize a component with timeline to match the display of the left resource click event, whether there is a case provided
Hello,
If you want to see the timeline and show the custom content over it, you need to add the resource timeline as usual, then use the overlay extension and specify the container position:
https://docs.dhtmlx.com/gantt/desktop__overlay_ext.html
Here is the updated snippet:
https://snippet.dhtmlx.com/cpm82ice
If you want to display eCharts exactly in the resource timeline, I don’t think there is an easy way to do that because the timeline consists of div elements and eCharts uses the Canvas element. And in that case, it would be easier to show the timeline cells in inside eCharts. But requires implementing a custom solution. If you want us to implement it for you, you can contact the Sales team:
info@dhtmlx.com