Dear all,
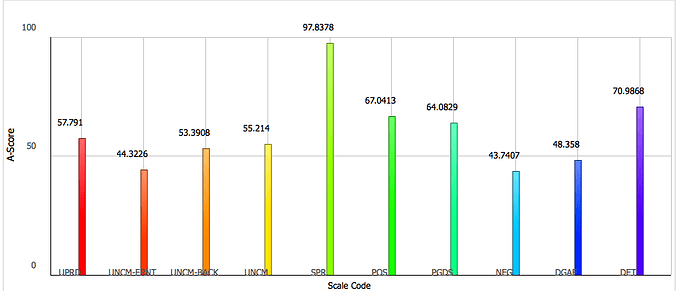
I am trying to create a bar chart using dhtmlX suite. Everything goes well except for x axis labels which appear above the axis instead of below (attached image).
The code I am using is
var barChart1 = new dhtmlXChart({
    							view: "bar",
   							container: document.getElementById(item),
    							value: "#A_Score#",
    							label: "#A_Score#",
    							width: 10,
    							gradient: "rising",
    							radius: 0,
   								tooltip: {
        							template: "#A_Score#"
    							},
   								xAxis: {
        							template: "#Scale_Code#",
        							title: "Scale Code"
   								 },
    							yAxis: {
        							title: "A-Score"
    							},
    							origin: 0
		 				});
						barChart1.parse(data[item], "json");
Am I doing something wrong ? Could there be a conflict with bootstrap 3 css classes since I am using bootstrap for the web layout.
Regards,
SM
