I am a pro user who has been using DHTMLX for a little over a year now.
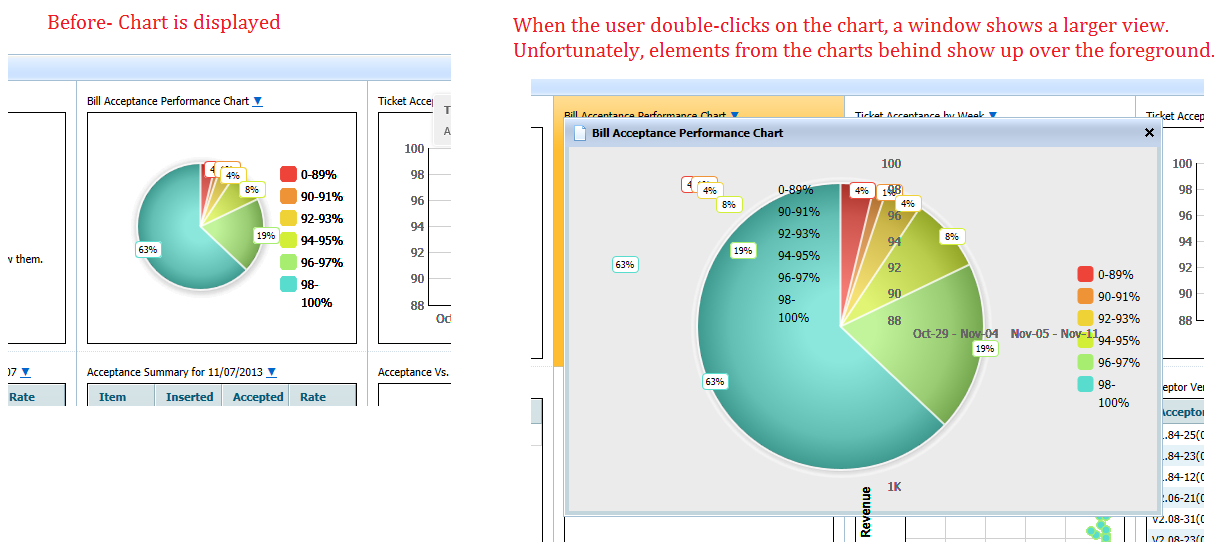
I have a page where I displays several small charts. When the user double-clicks on a chart, a dhtm window will pop up with a larger version of the chart to display more detail.
The problem is that when one chart is displayed over the other, the popup window does not fully overlap the data below. Elements from the chart behind are shown in front of the top chart.
This problem started with the following version:
dhtmlxSuite 2013 Rel.1 (DHTMLX 3.6) Professional edition build 130619
I have been able to work around this problem by using an older version of DHTMLX, but by doing this I am missing out on other feature enhancements and browser compatibility fixes in the newer updates.