Hi,
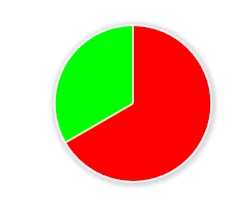
trying to init the chart with the code below, I always get a pie chart displaying the passed data:
jQuery(document).ready(function(){
var dhtmlxmyTestChart = new dhtmlXChart('myTestChart',{
"view":"bar",
"container":"myTestChart",
"value":"#value#",
"color":"#color#",
"legend":{"width":65,"align":"right","valign":"top","template":"#category#"}
});

dhtmlxmyTestChart.load('/mpintranet/www/index.php?r=charttime/jsonpieemployeesheet&id=1', 'json');
});
[
{"value":-0,"category":"2","color":"#6E8B3D"},
{"value":16,"category":"7","color":"#698B69"}
]Am I passing the wrong sytnax? Not sure about it, as the “values” are beiing displayed!
Regards Philipp
Darya
June 10, 2013, 12:01pm
#2
Hidocs.dhtmlx.com/doku.php?id=othe … leted_demo
Pls find attached the more or less compliant sample you asked for;)DHTMLXDEBUG.zip (523 KB)
Darya
June 10, 2013, 1:56pm
#4
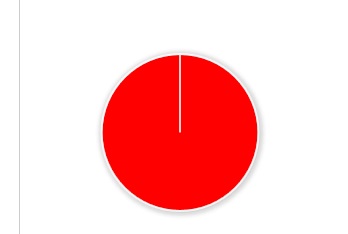
Sorry, I didn’t look initially that there are only 2 points of the values in your data, one of which is ‘0’. In this case your chart will be as on the picture:
Yes, I totally agree to the behaviour, but what about the chart config ?!
Thanks to your support
Darya
June 10, 2013, 2:44pm
#6
You confused me.
Darya
June 10, 2013, 3:06pm
#7
One more thing: correct your chart init a little:
var dhtmlxmyTestChart = new dhtmlXChart({
            "view":"bar",
            "container":"myTestChart",
            "value":"#value#",
            "color":"#color#",
            "legend":{"width":65,"align":"right","valign":"top","template":"#category#"}
    });
Ok, thanks a lot, the correction of the init solved it…! The funny thing is, I greped the init from your documentation! Maybe you can check it, so someone else will not fall into the same trap!
Darya
June 11, 2013, 9:34am
#9
Please, give me a link with incorrect code-snippets you’ve find.